
Why are my annual returns so far from average?
17 July 2020

“The true investor welcomes volatility … a wildly fluctuating market means that irrationally low prices will periodically be attached to solid businesses.”
—Warren Buffett
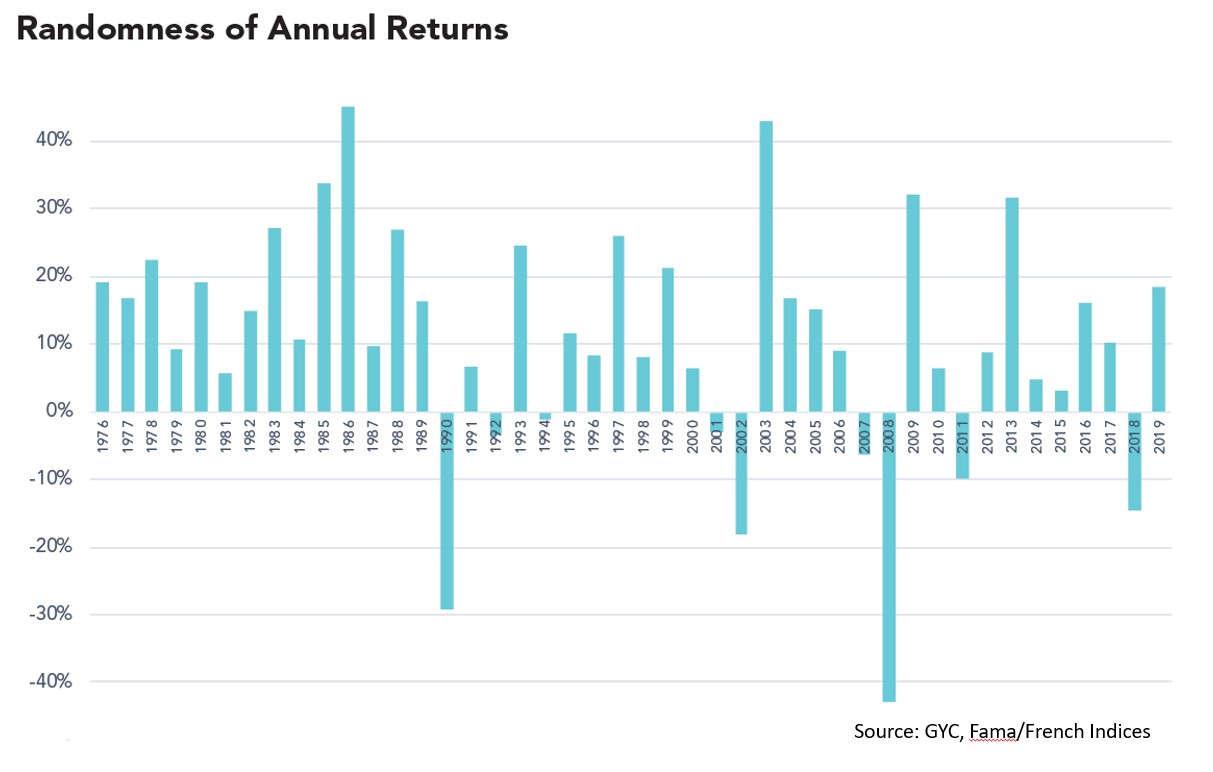
If you had invested in a diversified portfolio of global stocks in 1976 and held it all the way to today, you would have received a compounded annual return of around 8.5% (in SGD). (The simple annual average return would have been 10.8%.)
However, only 5 out of those past 44 years saw annual returns within two percentage points of that 8.5%. The returns for the other years were often wildly different. Some years produced sky-high returns as high as 45%. Others suffered massive losses as low as negative 43%. Most other years were somewhere in-between.
It’s a common mistake for investors to assume that average return rates can be expected every year. After all, that’s usually the case for the interest rate we receive from bank deposits. This misconception can cause investors to be disillusioned if a given year (or a few consecutive years) produces a return far below that annual average.
In such times, it can help to step back and take a look at the bigger picture. Average return rates already take those low or negative years into account. Since 1976, investors experienced 9 negative years out of 44 – which means a positive outcome 80% of the time.
Market downturns are thus only to be expected. The good news is what happens next.
If we use the longest dataset possible – a broad US market index tracking data from 1926 – we can see that stocks have tended to deliver very positive equity returns in the one-year, three-year and five-year periods following steep declines.
The effect is especially striking when we consider cumulative returns. Five years after sharp market declines of 10%, 20% and 30%, compounded returns all topped 50%. Viewed in annualized terms across the longest five-year period, those returns were close to the historical annualized average of 9.6% for the entire period.
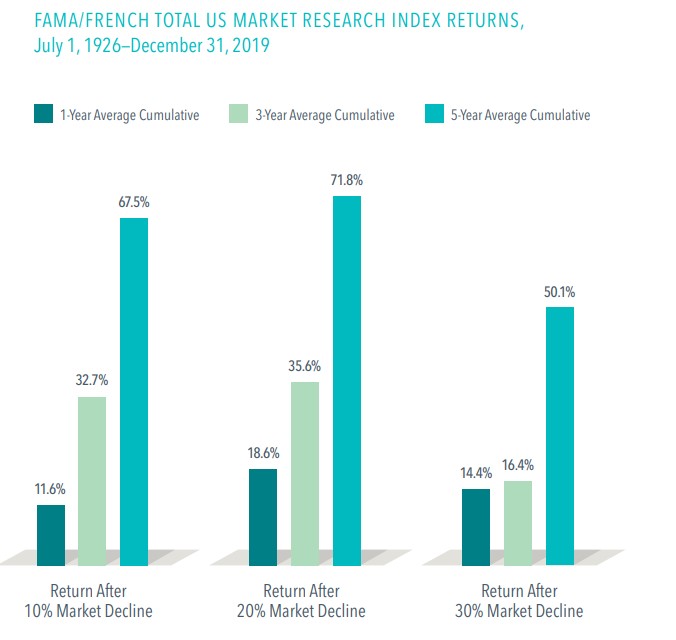
In other words, it’s in those few years after a market decline that investors see the bulk of their returns – right after many of them have sold out in panic.
Such behaviour is to be expected. Hitting a bumpy patch can set off a lot of fears and anxieties about when and if the market will recover. Why shouldn’t you wait until things are clearer before putting your money back to work? Unfortunately, this more often than not means you’ll be left waiting on the sidelines with cash in hand when the markets suddenly shoot back up.
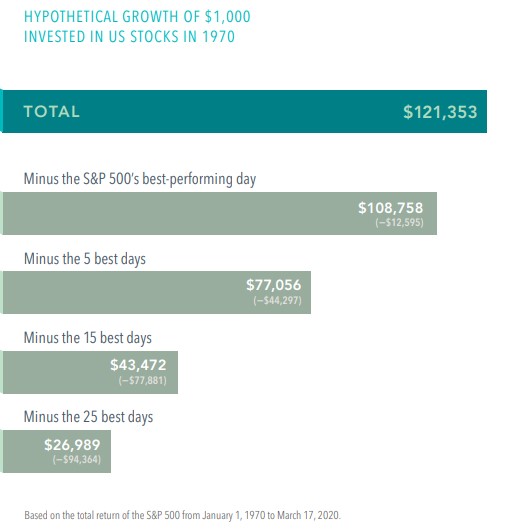
A lot of research has shown that missing the best days of the market can be extremely detrimental to your annual returns. The chart below illustrates just how bad this can be.
The road to investment success is not straight. Neither is it smooth. You may experience long periods where your returns don’t look anywhere close to their historical or projected average, but this doesn’t mean the numbers are wrong. As the evidence shows, it’s much more unusual for annual returns to be close to their average.
As long as your portfolio is well diversified, you can find comfort in knowing that investors can always expect higher returns following a bear market. March this year was an example of that. Panicking and selling at the wrong time will only hurt your long-term returns. Conversely, waiting it out will let you experience the good times that follow the bad. This is one reason that patient investors are rewarded.
Keep this wider perspective in view, and you’ll find it easier to stick with your investment plan and ride out the inevitable ups and downs. The road may not be straight, but it will get you to your destination in the end.
#
If you have found this article useful and would like to schedule a complimentary session with one of our advisers, you can click the button below or email us at customercare@gyc.com.sg.

Share
IMPORTANT NOTES: All rights reserved. The above article or post is strictly for information purposes and should not be construed as an offer or solicitation to deal in any product offered by GYC Financial Advisory. The above information or any portion thereof should not be reproduced, published, or used in any manner without the prior written consent of GYC. You may forward or share the link to the article or post to other persons using the share buttons above. Any projections, simulations or other forward-looking statements regarding future events or performance of the financial markets are not necessarily indicative of, and may differ from, actual events or results. Neither is past performance necessarily indicative of future performance. All forms of trading and investments carry risks, including losing your investment capital. You may wish to seek advice from a financial adviser before making a commitment to invest in any investment product. In the event you choose not to seek advice from a financial adviser, you should consider whether the investment product is suitable for you. Accordingly, neither GYC nor any of our directors, employees or Representatives can accept any liability whatsoever for any loss, whether direct or indirect, or consequential loss, that may arise from the use of information or opinions provided.

