
The Difference Between Weather and Climate
03 May 2019

“If you don’t like the weather in New England, just wait a few minutes.”
— Mark Twain
Singaporeans are no strangers to rapid changes in the weather. We know what it’s like to be drenched in sweat one moment and drenched in rain the next – you’ll be equally wet and miserable, but in excitingly different ways. In less-tropical parts of the world, a single day’s weather can run the gamut from sun to rain to snow. A cold front might suddenly descend in the middle of summer, sending people running back indoors for more clothes.
Climate, on the other hand, is much less fickle. Climate is defined as the average state of the daily weather condition in an area over a period of 30 years. It encompasses parameters such as humidity, atmospheric pressure, sea level and the ever-encroaching effects of global warming.
The daily changes in weather are a good representation of daily market movements. These can be highly volatile because markets are constantly incorporating the new information that comes in every day, hour and minute, based on events happening around the world.
The more eventful the news, the greater the volatility. If a company is rumoured to be bankrupt, stock prices might plummet as investors expect zero or less earnings in the future. Buyers might then only be willing to pay a low price for those stocks, which sellers would have no choice but to accept. Conversely, news about a possible trade deal between the US and China could drive up the prices of companies that do a lot of business between the two nations. Removing any uncertainty or impending tariffs would push up the expected earnings, making buyers more willing to pay a higher price.
However, just like how the current weather in a country should have little or no effect on your decision to visit in a few months, daily market forecasts have little to no use for long-term investors.
“We expect the market to tread water with a 1% gain,” said Goldman Sachs’ David Kostin in 2016. “Equity returns are not strong,” agreed Morgan Stanley economists, more pessimistically forecasting a -2% return for that year. In the end, the S&P 500 index ended 2016 with a 12.25% gain, including dividends.
According to the National Oceanic and Atmospheric Administration, the weather forecast has an accuracy rate of between 50 to 90%, with the accuracy rising as forecast duration shortens. In comparison, a study of the top market forecasters in the world revealed an accuracy rate ranging from 17 to 69%.
Most of you would probably never bet money on what the weather will be tomorrow, even with the aid of weather forecasts. After all, weather forecasts are notorious for being wrong. So, why then are people willing to bet millions on market forecasts, which are statistically proven to be even less accurate?
As Nobel laureate William Sharpe has pointed out (and so have we), forecasters would need at least a 74% accuracy if they were to have any hope of beating a buy-and-hold strategy, due to the transaction costs involved and the need for not one but two decisions (when to buy and when to sell) when acting on forecasts.
In the chart below, you can see the monthly movements of the global stock market, in Singapore dollar terms. Each month’s “weather” can vary so much from the next, with monthly returns ranging from +9% to -18%. If you were to focus on that, as many investors do, you would end up pulled left and right every other day.
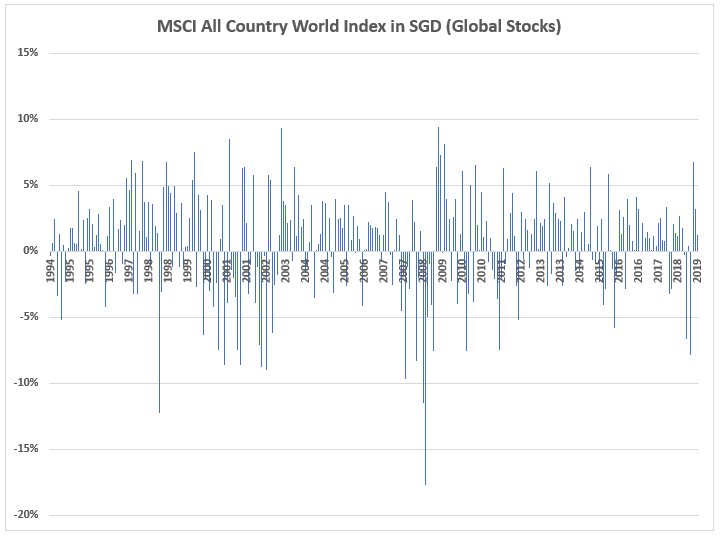
A better way would be to pull back and look at the bigger picture: the climate of the market. What does the entire market look like over a long time?
If you focus on the long-term “climate” rather than the short-term “weather” of the market, you’ll be able to see more clearly how your wealth can accumulate over time to fund the financial need or goal you have planned for it. It is a more important measure because it takes into account cumulative gains. However, it can only be done if you invest in a globally diversified portfolio holding thousands of securities (stocks and bonds).
The diagram below shows how the same global stock index featured previously has steadily grown over time despite the many negative news and worries about recessions, economic crises, currency wars, trade wars and the like. $1 invested in the mid-90s would have grown to $4.54 in 2019.
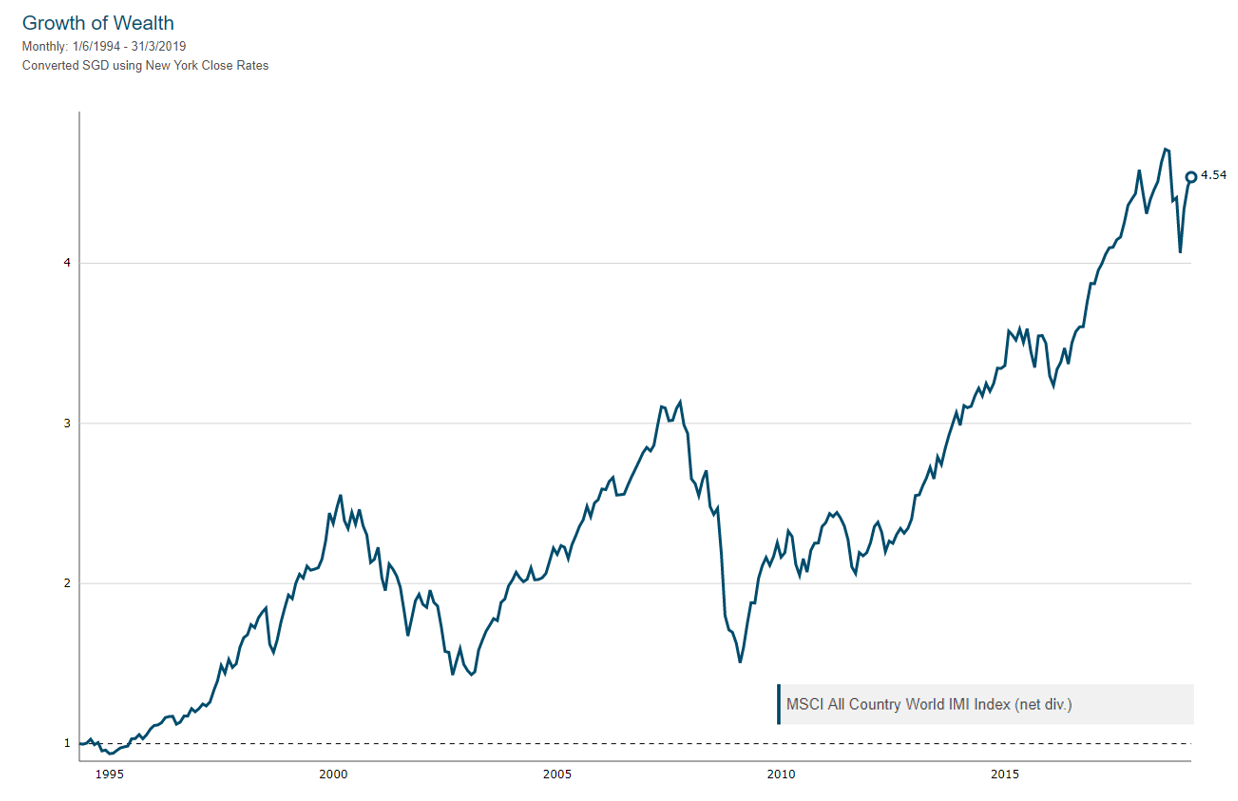
This growth of wealth can happen only through sufficient and proper diversification; holding just a handful of individual stocks is unlikely to give you the same result. History is awash with many examples of the boom and bust of individual stocks. A recent reported example would be that of the former blue chip company, General Electric.
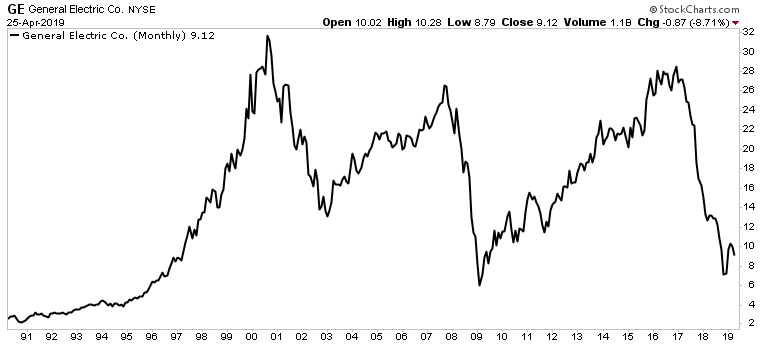
General Electric had been in the Dow Jones index since Charles Dow first created it in 1896. It was removed from the prestigious index in 2018, on the basis that it “no longer represented the American economy”. It was replaced by Walgreens, a pharmacy chain. But that was not before GE’s fall destroyed the wealth of many shareholders.
If you look at the price chart of GE below, you would see that it is very different from that of the stock market chart we just showed. Unless you had invested at the rock bottom prices of the early 90s, you would have faced losses even if you had held it through the decades.
So, market forecasts should be kept in the domain of entertainment and conversation fillers, and paid less heed than weather forecasts.
With your investments, it’s the climate that you need to focus on.
#
If you have found this article useful and would like to schedule a complimentary session with one of our advisers, you can click the button below or email us at customercare@gyc.com.sg.

Share
IMPORTANT NOTES: All rights reserved. The above article or post is strictly for information purposes and should not be construed as an offer or solicitation to deal in any product offered by GYC Financial Advisory. The above information or any portion thereof should not be reproduced, published, or used in any manner without the prior written consent of GYC. You may forward or share the link to the article or post to other persons using the share buttons above. Any projections, simulations or other forward-looking statements regarding future events or performance of the financial markets are not necessarily indicative of, and may differ from, actual events or results. Neither is past performance necessarily indicative of future performance. All forms of trading and investments carry risks, including losing your investment capital. You may wish to seek advice from a financial adviser before making a commitment to invest in any investment product. In the event you choose not to seek advice from a financial adviser, you should consider whether the investment product is suitable for you. Accordingly, neither GYC nor any of our directors, employees or Representatives can accept any liability whatsoever for any loss, whether direct or indirect, or consequential loss, that may arise from the use of information or opinions provided.

