
What the Data Tells Us About Stock and Bond Returns
30 April 2020

“Only buy something that you’d be perfectly happy to hold if the market shut down for 10 years.”
— Warren Buffett
One can argue that investors in the 21st century have it better than those who dabbled in the market just 20 or 30 years ago. Investing back then was a much more exclusive venture. Investment news and tools were locked behind hefty subscription fees, and investors would have faced considerable difficulty finding enough material to do their own research.
These days, however, financial news is everywhere. The wealth of freely-available investment research is more than one can read in a lifetime. Investment tools are all around for investors to tap on. You could practically run your own hedge fund from home.
The internet ushered in the age of information democracy. This arguably benefited humanity in many ways, but the deluge of information has also become a problem of its own. With our phones pinging every few moments with news alerts and other notifications, our human brains are almost constantly overwhelmed, unable to assimilate and make sense of all the information we are bombarded with.
This has been detrimental to our attention spans and ability to focus. For investors, it has also been detrimental to our investment outcomes – as we have often written about in our behavioural finance section.
There are many valuable insights to be gleaned from all the information we have out there, but this assumes that investors are able to find and use that data properly. One area where misconceptions persist is the topic of stocks vs bonds.
Many investors know that stocks are volatile. That fear keeps many of them away from the stock market, afraid that they could suddenly lose all of their money in a burst of bad luck. They therefore choose to put their money in bonds instead, which are perceived as being more stable and thus the safer option.
However, very few seem aware that, over the long term, stocks give positive returns and do not lose money. We can see this from the historical market records going back two centuries. The conditions for this are that you hold a very globally diversified basket of stocks (over 2,000) and do not trade it. The longer you hold, the more the returns converge towards a normal distribution.
The chart below illustrates what this looks like. Using a sample portfolio (100% globally diversified with tilts to specific drivers of return) and including fund fees and advisory fees, the chart shows how the wide range of possible performance outcomes narrows as time goes by. The longer you hold, the tighter the dispersion, and the more confident you can be – not just of getting a positive return, but of how much that return is likely to be.
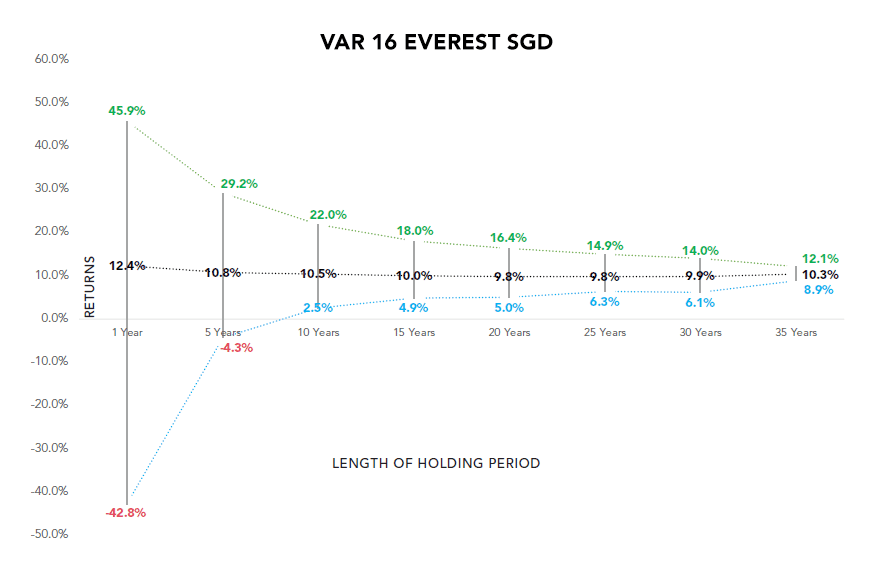
Source: GYC
In the meantime, investors have been living in a 30-year bond bull market. Many flocked to bonds after the 2008 financial crisis, motivated by fear from the crash and how long asset prices took to recover. Those motivations continue to be at the forefront of many investment discussions today. For the better part, their decision was rewarded. Most would have not experienced losses from bonds.
For investors who are too young to remember that interest rates were once in the double digits, the chart below shows the long-term trends of the various asset classes. The past two decades have seen investors go through a terrible bear market in stocks, whereas bond investors have been experiencing a continuous bull run.
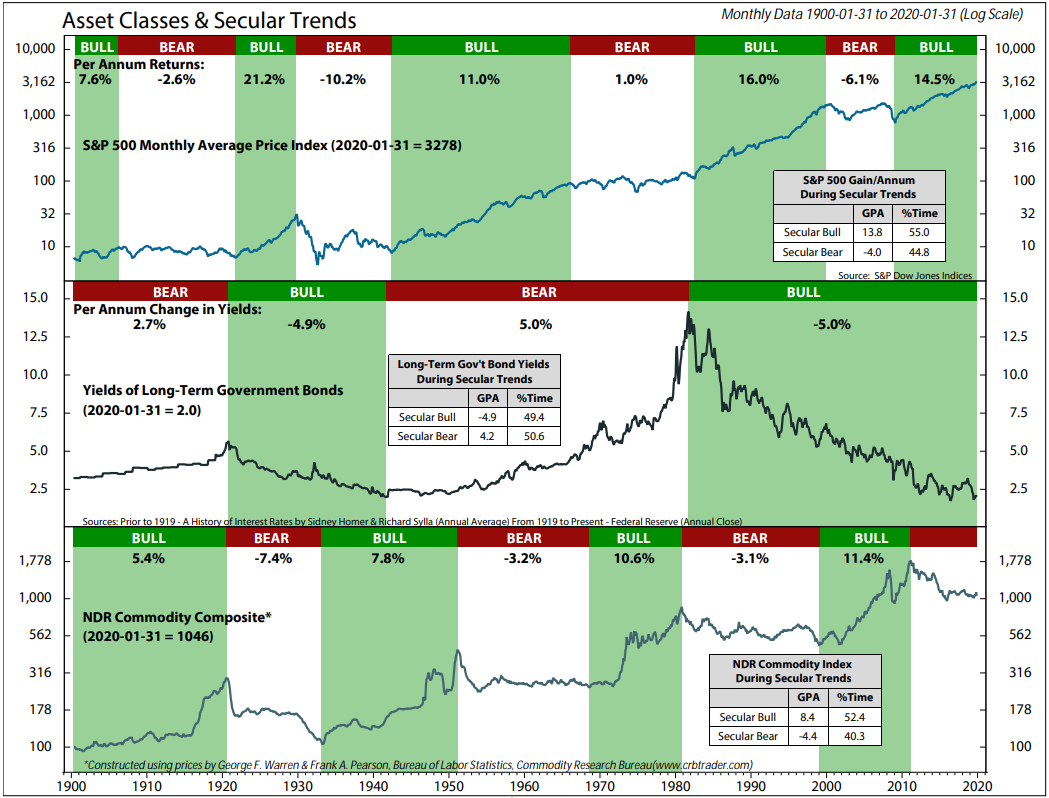
However, if we look at the past market data on bonds, we’ll find that there has actually been a large variability in returns. That includes negative returns, and bonds can stay negative for far longer than stocks. This is due to various reasons: such as the coupons being unable to make up for the capital losses, or bond defaults permanently wiping out capital.
The chart below is constructed with 50% in treasury bills (a cash equivalent) and 50% in a diversified aggregate US dollar bond index. Fund fees and advisory fees have also been taken into account.
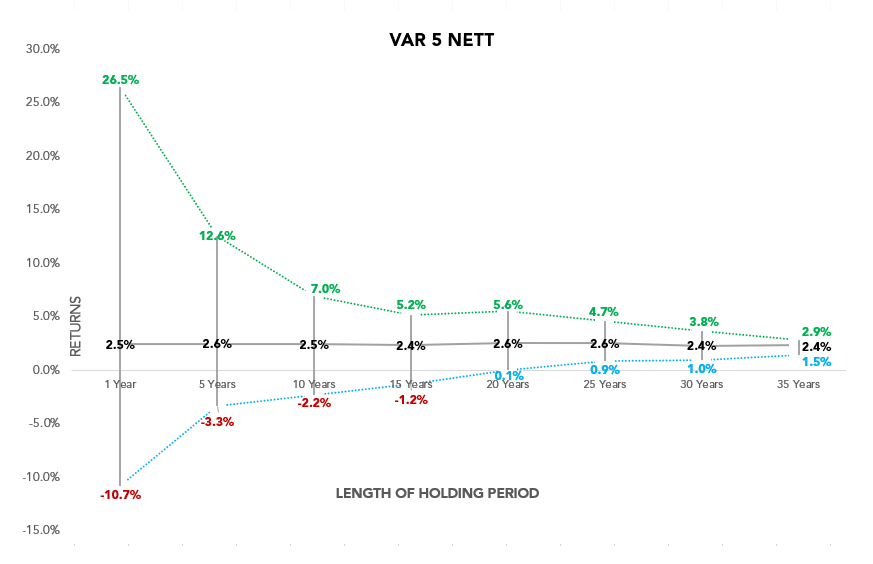
As you can see, even holding that bond portfolio for 20 years would have meant merely breaking even in the worst-case scenario. In contrast, globally diversified stock portfolios have historically produced guaranteed positive returns after 10-15 years in the worst-case scenarios.
It is wise to always keep in mind the saying, “History doesn’t repeat, but it often rhymes”. The years of market data we have can teach us invaluable lessons. They are especially relevant to help you keep track of how your investments can perform, and to ensure that your expectations will always be realistic.
#
If you have found this article useful and would like to schedule a complimentary session with one of our advisers, you can click the button below or email us at customercare@gyc.com.sg.

Share
IMPORTANT NOTES: All rights reserved. The above article or post is strictly for information purposes and should not be construed as an offer or solicitation to deal in any product offered by GYC Financial Advisory. The above information or any portion thereof should not be reproduced, published, or used in any manner without the prior written consent of GYC. You may forward or share the link to the article or post to other persons using the share buttons above. Any projections, simulations or other forward-looking statements regarding future events or performance of the financial markets are not necessarily indicative of, and may differ from, actual events or results. Neither is past performance necessarily indicative of future performance. All forms of trading and investments carry risks, including losing your investment capital. You may wish to seek advice from a financial adviser before making a commitment to invest in any investment product. In the event you choose not to seek advice from a financial adviser, you should consider whether the investment product is suitable for you. Accordingly, neither GYC nor any of our directors, employees or Representatives can accept any liability whatsoever for any loss, whether direct or indirect, or consequential loss, that may arise from the use of information or opinions provided.

