
Yield Curve Inversion? Read Between the Headlines
23 August 2019

“If you don’t read the newspaper, you’re uninformed. If you read the newspaper, you’re mis-informed.” – Mark Twain
If the news were any guide, it would seem that we’re living in an unending nightmare of global suffering and despair. While that may be true to some extent, surely there are also times when good things happen. So, why do we rarely hear about them? Why doesn’t the news media run more positive, upbeat stories?
According to psychologists and research studies, it’s because people don’t actually want to read happy stories. Instead, we seem innately drawn towards news that is depressing, horrifying or outrage-inducing. After all, it’s primarily those stories that we rapidly devour and rush to share with everyone else, making them go viral and garner revenue for media companies – thus motivating them to keep reporting on (or making up) the most terrifying bad news they can find.
Why do we react this way? One reason could be how our innate survival instincts make us pay more urgent attention to threats, engaging our fight-or-flight response to keep ourselves out of danger. Consuming such an uninterrupted stream of bad news keeps us stuck in that fight-or-flight mode and makes us sadder, angrier and more anxious than we otherwise would be.
And when it’s the financial media continuously broadcasting portents of doom to any listening investor, those investors often end up making impulsive and damaging changes to their portfolios.
Over the past few weeks, the financial media has been awash with numerous headlines about a yield curve inversion. But what is a yield curve, and why are investors so concerned about it?
Well, a yield curve is a plot of the different yields of the same type of bond across different maturity periods. Traditionally, a yield curve is upward-sloping, i.e. longer maturity bonds offer a higher yield than shorter maturity bonds to compensate for their higher risk. However, there are occasions when the yield curve slopes downwards, or “inverts”. This means that longer bonds have a lower yield than shorter-dated bonds. It is a sign that bond investors do not have confidence in the economy and have pushed up prices of the longer bonds – hence reducing their yields.
Research shows that the yield curve is a predictor of economic activity. An inverted yield curve could thus forecast a coming recession, due to more bond investors becoming bearish about the economy. A common concern for investors is then whether such an inversion might be a precursor to a decline in equity markets. And how do investors typically act if they expect stocks to decline? They sell first, and ask questions later.
Let’s see what that does.
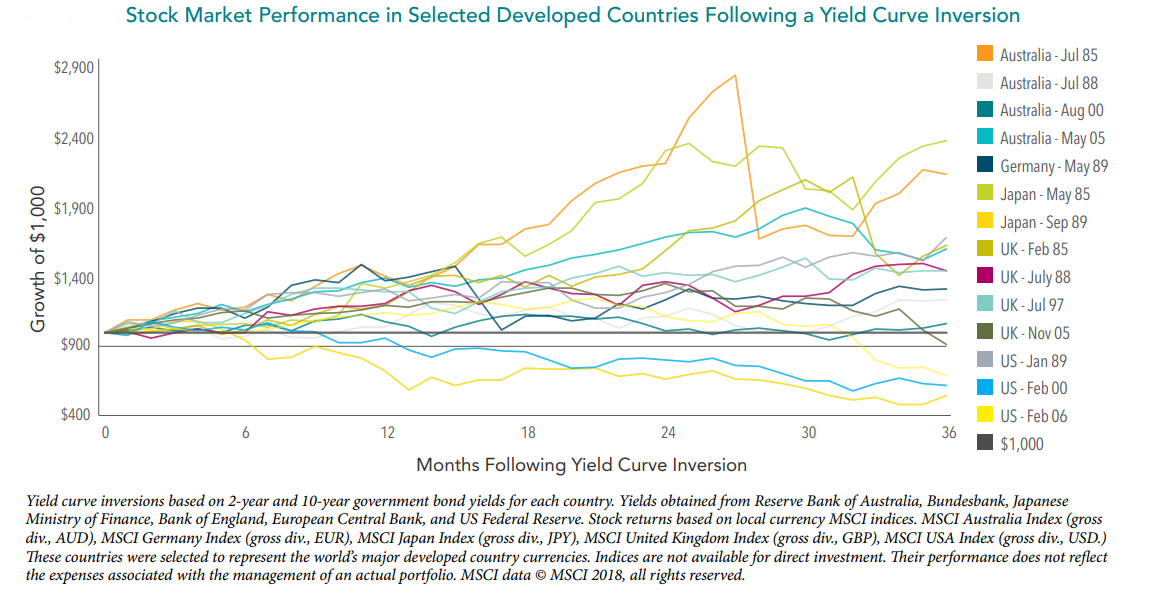
Research by Dimensional Fund Advisors shows that there is no reliable way to make (or save) money by getting out of stocks once the yield curve inverts. In fact, for up to 3 years from the date of the inversion, the stock market produced positive equity returns. Investors who sell and hold cash in apprehension of a recession thus end up losing out on those returns.
What gives? Firstly, yield curve inversions have not happened very often. Over the past 40 years, US yield curves have only inverted 5 times. That provides a poor statistical sample to base an important investment decision on.
In order to increase the sample size, data on yield curves and their related stock market performance was collected from countries around the world, as seen in the chart below. The conclusion is similar – there is no statistically significant basis for the claim that a yield curve inversion would cause an equity sell-off. The majority of the time, equity markets were positive.
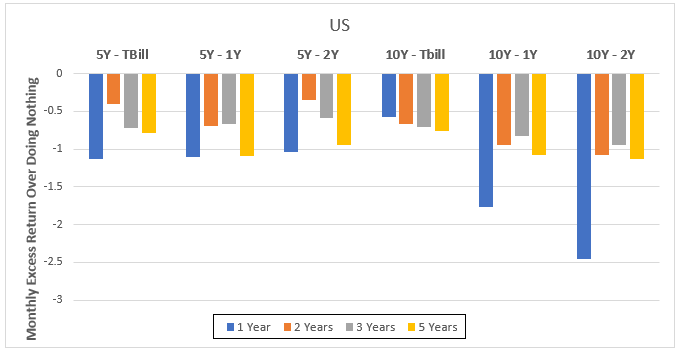
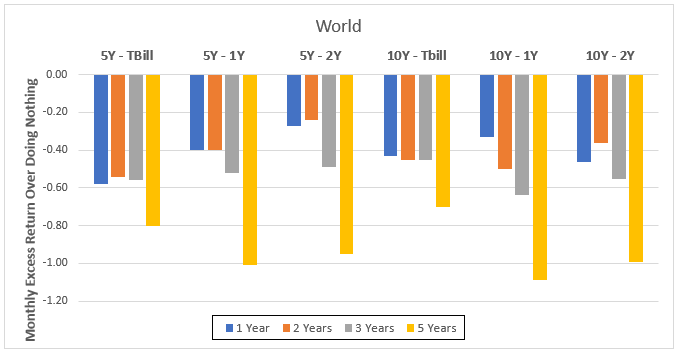
In addition, Nobel laureates Eugene Fama and Kenneth French recently drafted their latest research on yield curve inversions and stock market returns.
In the paper, they studied the performance of US and Global stock market returns following a yield curve inversion. They then compared the return of a passive buy-and-hold portfolio (which holds all the stocks of the respective market) with an active strategy that gets out of stocks and allocates to cash-like instruments (T-bills) when the yield curve inverts.
If the hypothesis that equity markets decline when yield curves invert is true, the active strategy should logically help an investor outperform the market. However, what the study found was that it is the active strategy that underperforms the market. That was the case even before any trading or transaction costs are factored in.
The charts below show the monthly underperformance of the various types of inversions tested, as well as the duration of the investment. It clearly shows that while yield curve information may have some relation to the economy, it does nothing to forecast stock market returns. Investors who try to adjust their portfolios in relation to this will only end up being worse off.
Time and time again, reacting to the news does not provide any value nor help investors make better decisions. As investors, we must instead expect that the markets are efficient and quick enough to assimilate news in an instant and have that be reflected in its prices.
It is always best not to worry about what is not within your control. Instead, work alongside a trusted adviser to build diverse portfolios designed around your own circumstances, goals, assets and risk tolerance. When it comes to growing your finances, paying less heed to such attention grabbing news will ultimately be more beneficial.
#
If you have found this article useful and would like to schedule a complimentary session with one of our advisers, you can click the button below or email us at customercare@gyc.com.sg.

Share
IMPORTANT NOTES: All rights reserved. The above article or post is strictly for information purposes and should not be construed as an offer or solicitation to deal in any product offered by GYC Financial Advisory. The above information or any portion thereof should not be reproduced, published, or used in any manner without the prior written consent of GYC. You may forward or share the link to the article or post to other persons using the share buttons above. Any projections, simulations or other forward-looking statements regarding future events or performance of the financial markets are not necessarily indicative of, and may differ from, actual events or results. Neither is past performance necessarily indicative of future performance. All forms of trading and investments carry risks, including losing your investment capital. You may wish to seek advice from a financial adviser before making a commitment to invest in any investment product. In the event you choose not to seek advice from a financial adviser, you should consider whether the investment product is suitable for you. Accordingly, neither GYC nor any of our directors, employees or Representatives can accept any liability whatsoever for any loss, whether direct or indirect, or consequential loss, that may arise from the use of information or opinions provided.

