
Should you react to disappointing investment performance?
06 December 2019

“The most important quality for an investor is temperament, not intellect.”
—Warren Buffett
Which amount are you more likely to donate: $9.70 or $10? Does a 60th birthday seem more significant than a 59th? If you answer yes to both these questions, you’re not alone. Most of us prefer the simplicity of round numbers.
It’s this same preference that leads many investors to review their performance by calendar year, and to look at 10-year periods when evaluating long-term returns. The recency bias also means that they tend to place greater emphasis on the latest period, and then extrapolate their results into the future.
However, there is nothing objectively more correct about looking at 10-year periods compared to 9-year or 11-year periods. Likewise, there is no good reason to consider the past 10 years more relevant to future performance than an earlier decade.
The problem is that each of those perspectives could lead us to very different conclusions. That is why it is crucial to look at your investments from the right perspective.
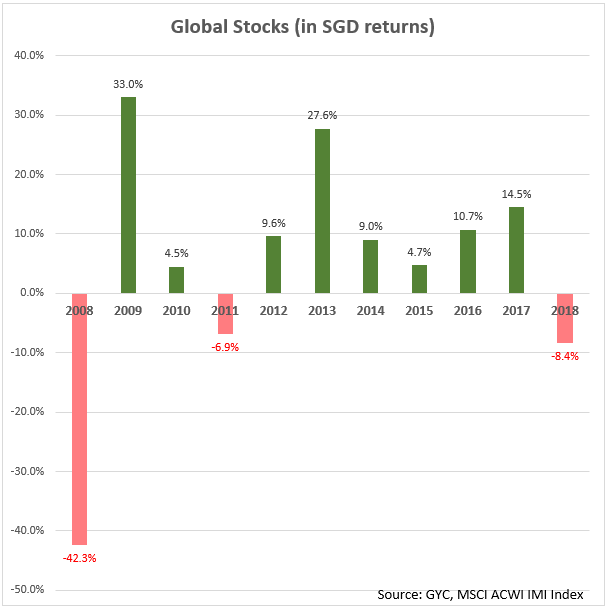
One good example would be to consider the 10-year period from 2008-2018. Annualised returns were a miserable 2.99%, before fees, and followed an emotionally rough investment decade that covered the Great Financial Crisis, European Crisis, Greek default, US downgrade, the rise and fall of ISIS, US-China issues, BREXIT… the list goes on.
However, as you can see from the diagram below, that 2.99% does not give the full picture. In fact, 70% of that period saw positive returns and significant market growth, but the massive losses in 2008 created a huge drag on overall performance that pulled the whole average down. Compounding this further, the value premium (the financial theory that lower-priced companies outperform expensive ones) failed to materialise, with value companies significantly beaten by high-flying growth companies.
But does that mean that stock investing doesn’t work, and that all those well-researched models and financial theories mean nothing? Absolutely not! They do work — but only if you look at them from a long-term perspective, and not arbitrary periods of time.
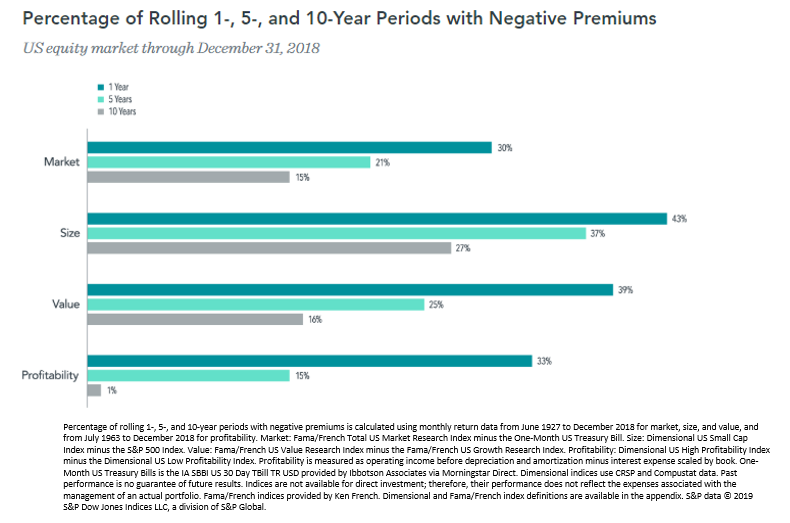
Apart from the value premium, we also expect market (stocks vs bonds), size (small companies vs large companies) and profitability (highly profitable companies vs those less so) premiums to be positive, as those are characteristics associated with higher returns. However, this does not happen every year.
The diagram below shows the frequency of negative premiums (i.e. when the expected premiums did not work) over rolling 1-, 5- and 10-year periods going as far back as available data. As you can see, negative years happen now and then, but they remain the minority. The odds of realising a positive premium are still in your favour, and will improve the longer you stay invested.
Yet despite compelling theoretical and empirical evidence supporting the premiums, investors may still be tempted to extrapolate the recent past into the distant future. This can lead them to abandon their investment philosophy at inopportune times. After long stretches of poor investment performance, they might decide that enough is enough and decide to take out their money to safekeep in the bank, or perhaps to invest into property instead.
This would be a huge mistake. Looking at the recent performance of premiums will not tell you much about their future performance. Maintaining discipline and sticking to your plan are vital to reap the long-term returns that will help you reach your financial goals. If your goals haven’t changed, your asset allocation likely doesn’t need to change.
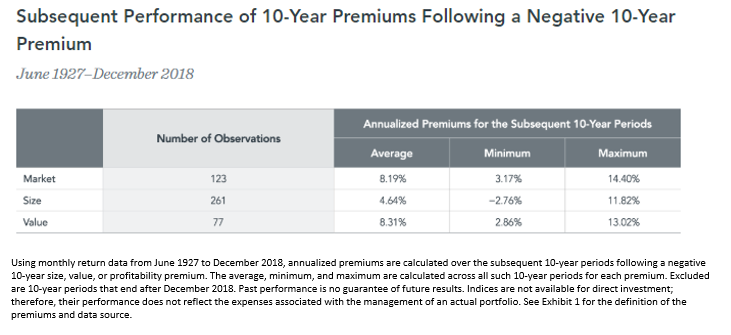
Analysing all the stock market data reveals a wide range of outcomes. Nonetheless, the data confirms that premiums have, on average, been positive after periods of underperformance. The table below identifies the rolling 10-year periods when a premium was negative, and notes how it behaved over the following 10 years. (Profitability is excluded as there are only two data points.) So, for long-suffering investors investing for long-term goals, don’t give up yet!
Premiums can also materialize quickly. You want to be properly positioned to capture the returns when they show up. The period leading up to and shortly after the start of the 21st century provides an extreme, albeit anecdotal, example.
The diagram below shows the performance of the Russell 1000 Growth and Value indices. Growth beat value over every trailing period from 1 to 20 years ending 31 March 2000. Many investors found themselves questioning a value strategy, wondering if expected returns were still related to the price paid for a stock in the so-called “new economy.”
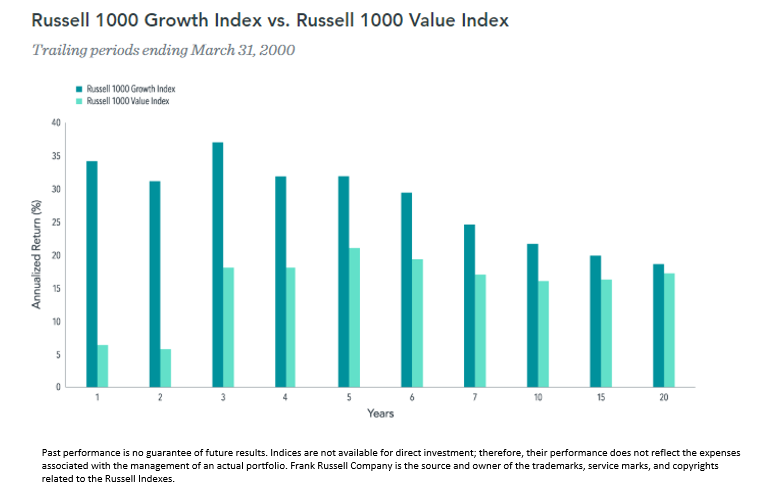
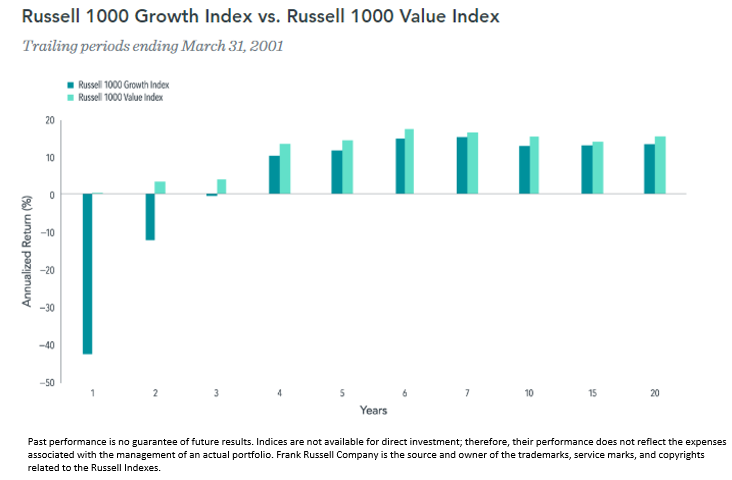
Investors who capitulated to this line of reasoning may have regretted their decision a mere 12 months later. As illustrated in the chart below, the value index strongly outperformed the growth index over every trailing period from 1 to 20 years ending 31 March 2001.
The moral of the story? While negative outcomes are disappointing, view them with the proper perspective and stay the course.
#
If you have found this article useful and would like to schedule a complimentary session with one of our advisers, you can click the button below or email us at customercare@gyc.com.sg.

Share
IMPORTANT NOTES: All rights reserved. The above article or post is strictly for information purposes and should not be construed as an offer or solicitation to deal in any product offered by GYC Financial Advisory. The above information or any portion thereof should not be reproduced, published, or used in any manner without the prior written consent of GYC. You may forward or share the link to the article or post to other persons using the share buttons above. Any projections, simulations or other forward-looking statements regarding future events or performance of the financial markets are not necessarily indicative of, and may differ from, actual events or results. Neither is past performance necessarily indicative of future performance. All forms of trading and investments carry risks, including losing your investment capital. You may wish to seek advice from a financial adviser before making a commitment to invest in any investment product. In the event you choose not to seek advice from a financial adviser, you should consider whether the investment product is suitable for you. Accordingly, neither GYC nor any of our directors, employees or Representatives can accept any liability whatsoever for any loss, whether direct or indirect, or consequential loss, that may arise from the use of information or opinions provided.

