
What We Should Be Worrying About in the Markets
10 April 2018

Trade War, Overvaluation, Flight to Safety, Rising Bond Yields, Rate Hikes, Loss of Momentum, End of the 9-Year Bull Market. If you have read the financial news recently, you would be forgiven for thinking that it might well be the end of the world. Those headlines might also make you start wondering:
- Should I get out now and hold cash?
- What about bonds? Shouldn’t I hold more bonds now?
- Should I buy stocks now, or perhaps wait for a better time?
- Why is everything so volatile?
- Trump is probably going to destroy the world economy. Should I sell out my investments to cash?
Just to put things in perspective, the losses we encountered in recent weeks are normal (yes, that’s right!). Such periods of down and scary markets should be expected whenever you invest. In other words – The Market is Functioning Normally.
As of the time of writing, the global stock market is down around -3.5% (in SGD terms) year-to-date, despite recent headlines about a record drop in the Dow Jones index. Let’s not forget that the Dow comprises only 30 US companies and is thus not really representative of the broader market of several thousand stocks. In addition, because the index has risen so much over the years to over 25,000 points (it started in 1886 at 62 points), it is only logical that gains and losses would now move over a greater number of points. Investors holding globally-diversified portfolios with allocations into fixed income are likely to experience smaller losses than a 100% equity portfolio.
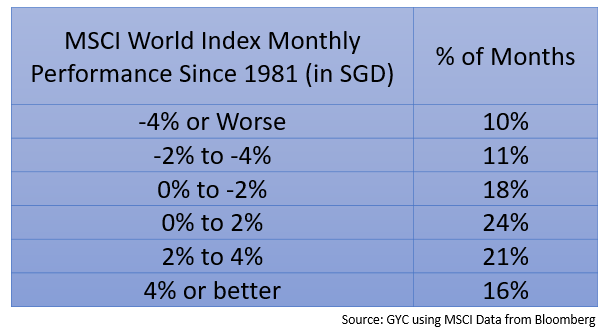
Coming back to the recent correction, the table below breaks down the monthly performance of a global equity index since 1981, accounting for nearly 450 trading months. February and March’s losses were in the -3.5% range, which has occurred 11% of the time in history. This means that such losses happen around every 1 in 10 months. The following statistics also show that markets go up more often (more than 60% of the time) than they go down. This should not be surprising. If it wasn’t the case, investors could not expect a positive return for investing in markets, and it would mean that markets would have stayed flat or gone down in the long run.
The holy grail of investing is a strategy that would allow an investor to avoid the losses that come from investing and capture all the gains. So far, nobody has been able to do this consistently, or else he or she would be insanely wealthy. However, investors continue to chase this dream, putting money with managers who claim to do the impossible, without realising the statistical difficulty of achieving such a feat. Following the large bear markets of 2000 and 2008, investors prefer protecting their capital over seeking returns. There is certainly no shortage of timing strategies trumpeted on the Internet or in financial publications which purport to help investors sell at market tops and buy at market lows. Knowing that the stock market goes up the majority of the time, an investor who is waiting on the sidelines to invest is exposing him or herself to missing out on good days in the market.
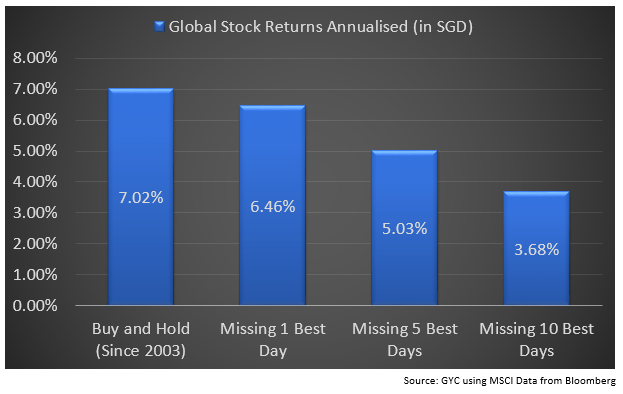
The chart below shows the effects of missing out on just the 1, 5 and 10 best days of the market on an investor’s long-term return just because they were sitting on cash waiting for the right time to buy. They would need to chase an incredible amount of return just to catch up with “dumb” buy and hold investors. Furthermore, they would also need to wait for the next crash or crisis to buy in, and even then, the guile and fortitude to invest when everything appears gloomy and foreboding makes this highly unlikely.
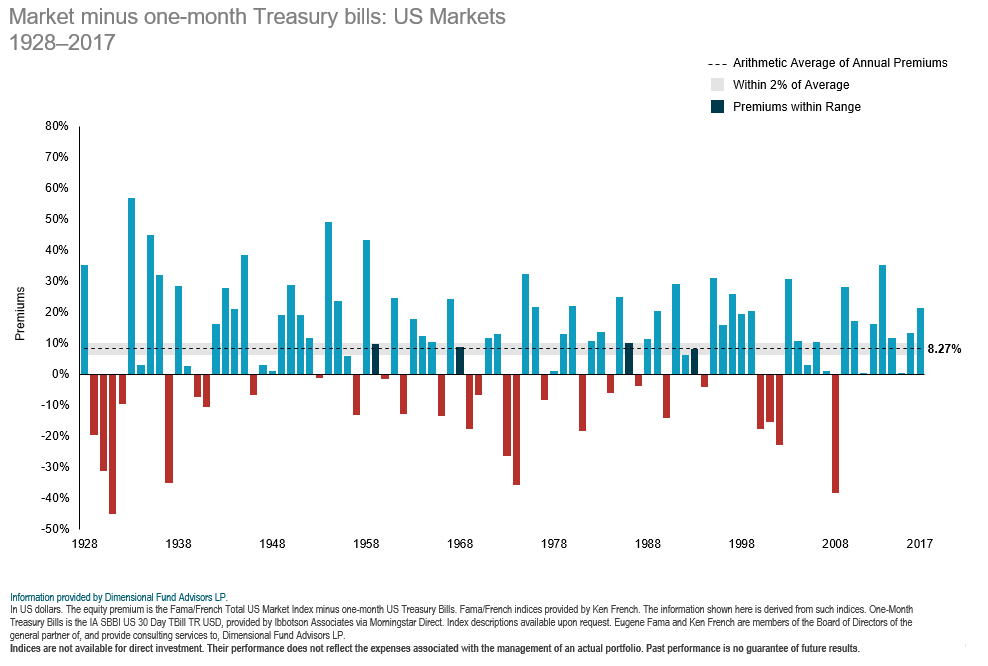
Investors should not forget that any long-run return projections from investing include both good and bad investing periods. Long-run projected returns also include just a single annualised number, but markets never return consistent numbers and are at best lumpy (hence the use of average returns). The example we used below shows very long-term annual returns from the US stock market (in USD terms). Whilst the stock market has provided an average return of 8.27% over the past 89 years, there was no a single year when the stock market returned that exact number. In fact, there were only 4 out of 89 years when returns came close to it. The rest of the time, the market’s returns swung wildly one way or the other. If you had jumped into the market after a period of solid returns and then experienced a market sell-off, you would be feeling the pain, and vice-versa. However, take comfort from this: if you count the number of positive years over the negative ones, you would notice that again, statistically, they stand at over 60%.
What about market timing? Everyone would like to invest in the 60% of the time when the market is positive, and avoid the 40% of the time when it is negative. It is this that drives investors to look at all sorts of signals – some logical, some quirky and some downright absurd – to try to achieve better than market returns. Heard of the Super Bowl indicator? What about Sell in May? Or perhaps the unlucky rule of 7, where a crisis is supposed to hit stocks in every year ending with 7? What about using Twitter chatter to predict stock market returns – not forgetting that Twitter has only been around for 12 years, whilst the stock market had been around for hundreds? What about more widely accepted mean reversion theories &nadsh; when stocks are expensive (above a certain P/E ratio), to sell and hold cash or bonds, and buy only when it is below a certain P/E number?
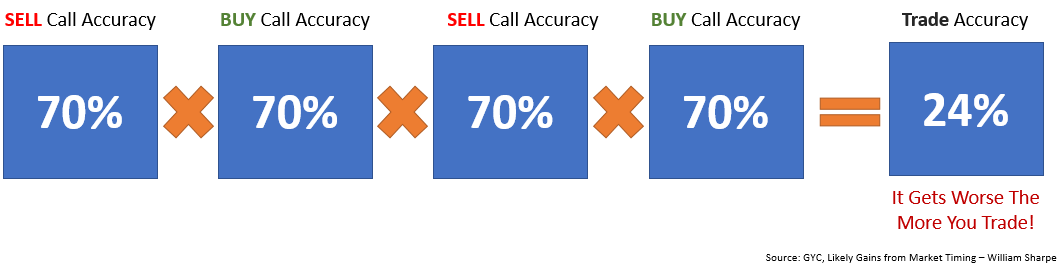
In a study done over 40 years ago by Nobel Laureate William Sharpe, titled “Likely Gains from Market Timing“, he concluded that someone timing the market needed to be right over 70% of the time. While being right 3 out of 4 times doesn’t seem so difficult, this statistic becomes exponentially more difficult when you have to make multiple decisions in a row. Couple this to the friction which occurs during trading, such as costs and time lag, which eat away at the returns, and you require an even higher “win” percentage than 70% (see Arithmetic of Active Management, William Sharpe).
Many investors forget that market timing involves two decisions – when to SELL and when to BUY. At times, you may be able to get one or the other correct, but what happens when you need to make two consecutive calls? A group of researchers expanded on an original study by the CXO Advisory Group to evaluate the accuracy of professional market forecasters and strategists. They found that there were only 4 forecasters out of a group of 68 who were able to achieve an accuracy of over 70%! Furthermore, it is unknown whether these forecasters will continue to be successful in the future.
For argument’s sake, lets assume your investment calls have a 70% accuracy. The diagram below shows what happens during one trade.
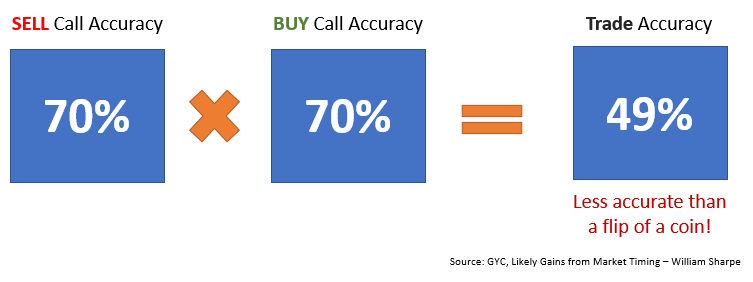
The probability of your outcome is slightly worse than a 50/50 chance – and this is without factoring in trading costs which will bring down the accuracy further. What if you had to trade more than once? Your likelihood of success goes down to a dismal 24%. If you had to string more and more trades together, well… you can see where we are going with this.
As for volatility, why is everyone suddenly so surprised by it? The recency bias which affects every single one of us is partly to blame. After being lulled into a comfortable environment in 2017 where the stock market was mostly benign and making gains, many have forgotten that volatility is part of investing. Investors could also be forgiven for thinking that the bull market could be over, after the sharp sell-off in Feb 2018, as they had to dig back into their memory banks to remember that the last sharp sell-off occurred in 2016 on the back of the collapse of oil price and the China yuan devaluation story.
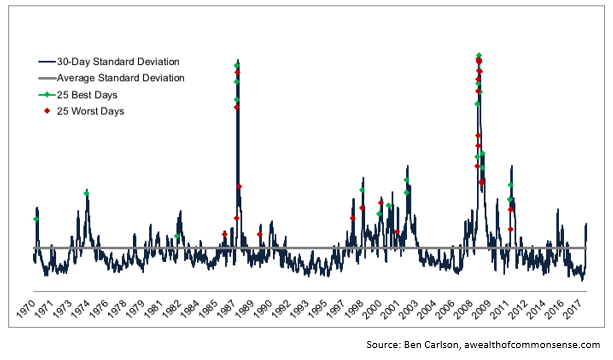
But just how bad is the volatility problem, which has been widely reported in the news of late? In the chart below, which shows data from the CBOE VIX index, you will notice that volatility usually clusters up. There have been long periods of relatively low volatility, and there have been short periods of extreme volatility.
The episode we just experienced in early 2018 doesn’t rank very highly in the volatility stakes compared to the events of 1987 Black Monday and the 2008 GFC. What you will notice is that the best and worst days of the stock market usually occur during periods of high volatility. This is the primary reason why it is so difficult to time the market – the markets swing so wildly, such that whether you are positioned to buy or sell, it is extremely challenging to be able to execute it properly. In addition, recent studies done by Nobel Laureate Daniel Kahneman show that we are ill-equipped psychologically to deal with extreme events, especially when we look at our investments that are suffering losses. Volatile markets goad investors into taking unnecessary risks and making unnecessary portfolio changes which are devastating to long-term returns.
So, what are the key takeaways for all investors?
- No one can predict exactly which way markets will go, but having a simple understanding about how markets typically function and have functioned in the past will provide proper context into what is happening. Don’t be emotionally swayed by the headlines.
- Investing requires that investors take some risks. It is what you need to endure in order to achieve a return. Long run returns include all market environments, both good and bad, so long as you remember the history of markets and don’t suffer a panic attack every time the market drops!
- Remember why you started investing in the first place. It was probably not to win the grand prize of being “The Investor with the Highest Return”, but more likely was to achieve certain objectives in the future. Keep to your own loss tolerance and don’t meddle with your portfolio every other week or month.
- Long-term success from trading is quite low even before factoring in costs. Stick to a well-thought-out financial plan, and remember that doing less is more. Strategies which claim to be able to beat the market or achieve out-sized returns are probably not telling you the whole truth.
Happy Investing!
#
If you have found this article useful and would like to schedule a complimentary session with one of our advisers, you can click the button below or email us at customercare@gyc.com.sg.

Share
IMPORTANT NOTES: All rights reserved. The above article or post is strictly for information purposes and should not be construed as an offer or solicitation to deal in any product offered by GYC Financial Advisory. The above information or any portion thereof should not be reproduced, published, or used in any manner without the prior written consent of GYC. You may forward or share the link to the article or post to other persons using the share buttons above. Any projections, simulations or other forward-looking statements regarding future events or performance of the financial markets are not necessarily indicative of, and may differ from, actual events or results. Neither is past performance necessarily indicative of future performance. All forms of trading and investments carry risks, including losing your investment capital. You may wish to seek advice from a financial adviser before making a commitment to invest in any investment product. In the event you choose not to seek advice from a financial adviser, you should consider whether the investment product is suitable for you. Accordingly, neither GYC nor any of our directors, employees or Representatives can accept any liability whatsoever for any loss, whether direct or indirect, or consequential loss, that may arise from the use of information or opinions provided.

