
Do You Know How Much Your Investments Could Lose?
10 February 2017

The financial industry’s favourite metric to measure risk for any product is Standard Deviation or Volatility. However, we find that Volatility is not a useful metric as it does not tell an investor how much risk he is taking. Volatility is merely the fluctuation of returns around a mean!
We prefer to use a term called VaR or Value-at-Risk. VaR is a statistical measurement of possible loss in an investment portfolio over a specific time frame. This is a better measurement of investment risk as it can estimate (statistically) how much the investment portfolio can lose so that the investor is aware of how their equities or bonds will react in a normal market cycle and also in an adverse market cycle.
VaR can be measured in various ways – either forward looking or backward looking. As we cannot tell the future, the forward looking VaR computation uses a Monte Carlo Simulation. (you may read up more about Monte Carlo here or here). Backward looking VaR measurements use historical data from asset classes to derive the results. Whilst it is fairly accurate, backward looking simulations are affected by recent history (imagine just coming out from the 2008 financial crisis – the VaR simulation based on historical data would be exceptionally high). The picture belows shows a sample VaR test we conduct on our portfolios. Note that the measurement of VaR is affected by the time horizon you are estimating and also the level of confidence (95%, 97.5% or 99%).
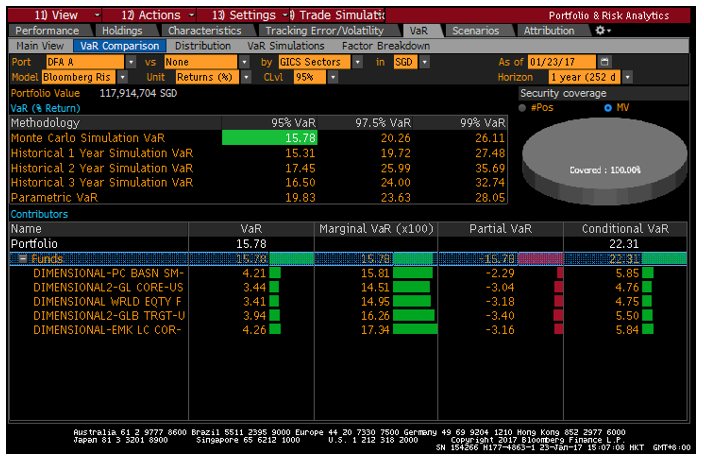
Source: GYC, Bloomberg
The main reason why we do not like standard deviation measurements is (like discussed earlier) Volatility measures the returns above or below a mean. It does not tell an investor how much this product/investment can lose – only whether it fluctuates a lot or a little! So a low volatility product or investment will have a small standard deviation (chart on the left) but that also means it would have a low return as the fluctuation or the returns is smaller. A high volatility product or investment will have a large standard deviation (chart on the right) and that would mean that the returns could be higher.
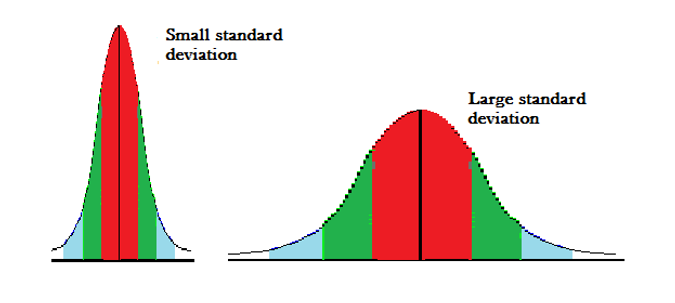
Source: Statistics How To
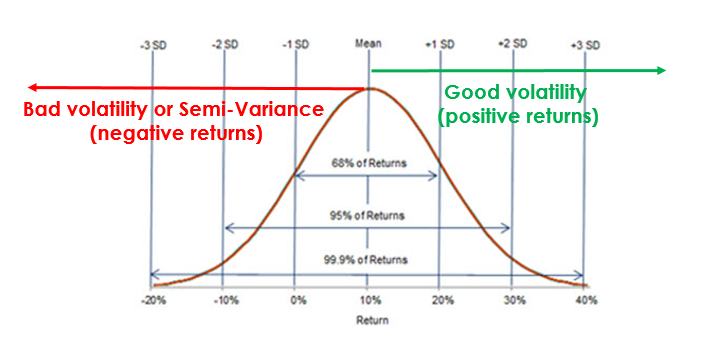
Still on volatility – there is both good and bad volatility. Good volatility provides positive returns, and the bad volatility (or semi-variance) gives the negative returns. The chart below shows what we have just discussed. As such, a statistic like; XYZ Fund has a annualised return of 6.2% and a standard deviation (or volatility) of 17% is meaningless – as all it tells the investor is that 95% of the returns falls within +/- (17% x 2) of 6.2%. It does not tell the investor the possible loss.
In our last example, we use a statistic from a well-known fund manager. We are not against nor are we trying to put this fund manager down and are merely using them as an example. In the fund factsheet, it states that the annual volatility of this China fund is 21.3%. However, when we do an actual VaR test on the fund, it shows that the 1-year Value-at-Risk of the fund is 33.12% at a 95% confidence level. What it means that in any given 1 year timeframe, the possible loss for investors holding this fund will range from 33.12% and below 95% of the time. So there could be a 5% chance that an investor could lose much more than 33.12%!
In wrapping up this post, we urge all investors to be more aware of risks and also to ask the correct questions – how much could I lose from my investments, and do not use the standard measurement of volatility to do so!
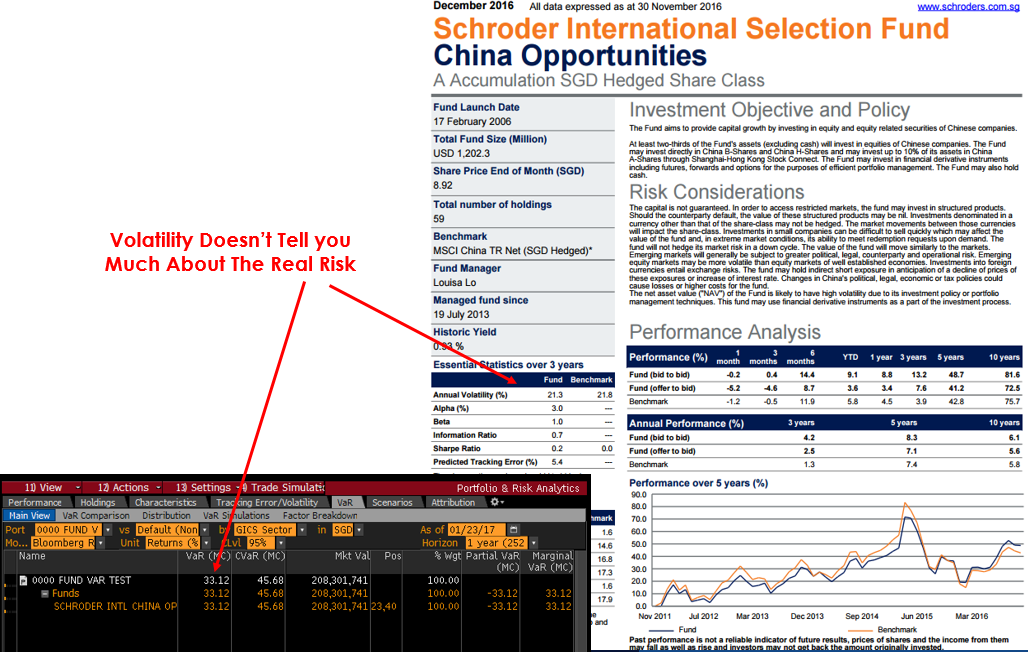
Source: Schroders
#
If you have found this article useful and would like to schedule a complimentary session with one of our advisers, you can click the button below or email us at customercare@gyc.com.sg.

Share
IMPORTANT NOTES: All rights reserved. The above article or post is strictly for information purposes and should not be construed as an offer or solicitation to deal in any product offered by GYC Financial Advisory. The above information or any portion thereof should not be reproduced, published, or used in any manner without the prior written consent of GYC. You may forward or share the link to the article or post to other persons using the share buttons above. Any projections, simulations or other forward-looking statements regarding future events or performance of the financial markets are not necessarily indicative of, and may differ from, actual events or results. Neither is past performance necessarily indicative of future performance. All forms of trading and investments carry risks, including losing your investment capital. You may wish to seek advice from a financial adviser before making a commitment to invest in any investment product. In the event you choose not to seek advice from a financial adviser, you should consider whether the investment product is suitable for you. Accordingly, neither GYC nor any of our directors, employees or Representatives can accept any liability whatsoever for any loss, whether direct or indirect, or consequential loss, that may arise from the use of information or opinions provided.

