
Overreacting During a Market Crash
01 November 2016

We recently came across Salil Mehta’s blog, which provides very insightful analyses of various statistical applications and discusses the basics of probability and statistics. Salil is a statistician and risk strategist who served for two years as Director of Analytics in the U.S. Department of the Treasury for the Administration’s $700 billion TARP program. He is the former Director of the Policy, Research, and Analysis Department in the Pension Benefit Guaranty Corporation.
In one of his posts, he conducted historical analyses on market crashes over time and discusses why many so-called “tail-risk” funds which purportedly time assets out of risk ended up selling at huge losses and incurring much more risk than clients thought possible. For long term investors, if you had no idea what to do, the best thing would be to hold through such a period. After all – for long term investing of 15-20 years, what is a bear market of 3-6 months in the context of the duration you hold on to your assets?
Interestingly, Salil showed three common scenarios of bear markets:
A. a slow collapse into maximum fear, then followed by a torrid fall

B. a rapid drop into maximum fear, then subsiding into a slow and chaotic recovery with retests
C. a straightforward drop terminating in maximum fear, then a shallow and jerky rebound back to “stability” (even if temporarily)

Given what we read in the financial media, watch on the news or listen to what our brokers tell us, majority would erroneously assume that market crashes frequently occur in the order shown – that is, more are of pattern A than of pattern C. We’ll see however, even if counter-intuitive, that the total reverse has been true.
A look back at market crashes since the 50’s shows that there had been more Scenario C’s than any others. This makes market timing immensely difficult and whilst some may be able to avoid further losses, there would not be sufficient time to buy back into the market, leaving the investor stranded.
1950: crash of -4% over 4 days; then -3% over following 5 days. Pattern A
1955: crash of -6% over 2 days; then +1% over following 7 days. Pattern B
1962: crash of -14% over 5 days; then +5% over following 7 days. Pattern C
1987: crash of -35% over 8 days; then +9% over following 20 days. Pattern C
1989: crash of -7% over 2 days; then +2% over following 2 days. Pattern C
1997: crash of -10% over 3 days; then +7% over following 6 days. Pattern C
1998: crash of -13% over 4 days; then +3% over following 2 days. Pattern C
2000: crash of -10% over 3 days; then +6% over following 4 days. Pattern C
2008: crash of -27% over 15 days; then -2% over following 46 days. Pattern B
2011: crash of -14% over 5 days; then +6% over following 7 days. Pattern C
2015: crash of -10% over 4 days; then +5% over following 4 days. Pattern B
Our own simple analysis of markets over a 15 year period also shows that markets go up more often than come down. In the picture below where we constructed a balanced portfolio using index funds, you will notice in the circled numbers that the percentage of up months (61%) is nearly double the percentage of down months (38%). And this was during the recent 2008 financial crisis! As such, investors trying to avoid the down months would more likely miss the up days of the market, resulting in severely underperforming portfolios.
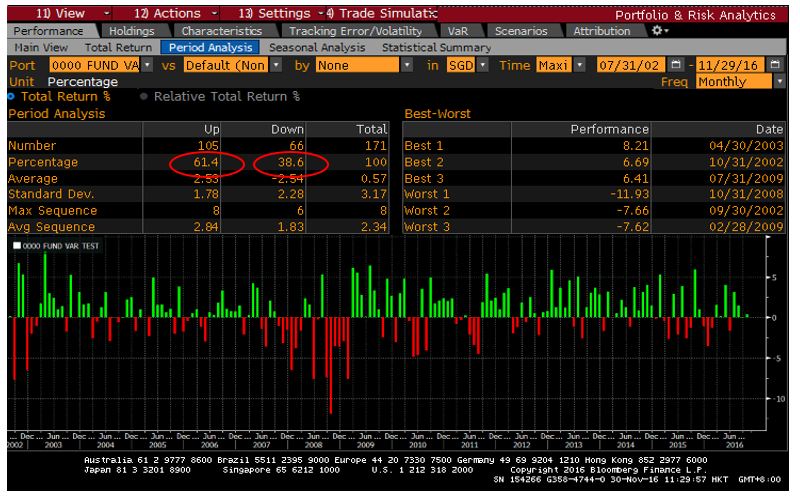
Source: GYC, Bloomberg
Typically, the best market days always follow a correction. One of numerous studies on missing up days in markets (this one done by JPMorgan Asset Management) shows that a 100% S&P 500 portfolio would achieve an annual return of 9.85% even with the bear markets. However, if one were to time it to miss just a few good days, the return drops quite significantly. Behaviorally, investors dislike “chasing” the market, especially after it has risen quickly after bottoming – falsely thinking that a better opportunity would present itself for them to buy in.
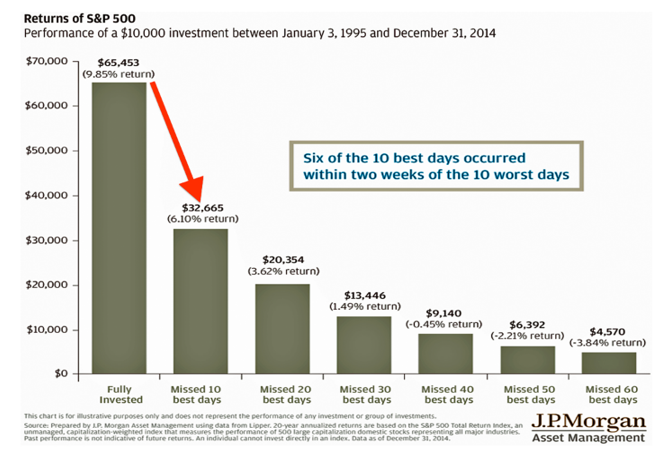
Source: J.P. Morgan Asset Management
In another study conducted by the University of Michigan, out of 31 years of market trading days (which equate to 7,802 trading days), they noted that only 90 days (1.15% of all trading days) generated 95% of the market returns. So, for investors who still believe they can time in and out of the market with precision, please consider this data carefully. We are not saying you cannot make money from timing, but it is getting the process right day-in, day-out which makes probability not in your favour!
#
If you have found this article useful and would like to schedule a complimentary session with one of our advisers, you can click the button below or email us at customercare@gyc.com.sg.

Share
IMPORTANT NOTES: All rights reserved. The above article or post is strictly for information purposes and should not be construed as an offer or solicitation to deal in any product offered by GYC Financial Advisory. The above information or any portion thereof should not be reproduced, published, or used in any manner without the prior written consent of GYC. You may forward or share the link to the article or post to other persons using the share buttons above. Any projections, simulations or other forward-looking statements regarding future events or performance of the financial markets are not necessarily indicative of, and may differ from, actual events or results. Neither is past performance necessarily indicative of future performance. All forms of trading and investments carry risks, including losing your investment capital. You may wish to seek advice from a financial adviser before making a commitment to invest in any investment product. In the event you choose not to seek advice from a financial adviser, you should consider whether the investment product is suitable for you. Accordingly, neither GYC nor any of our directors, employees or Representatives can accept any liability whatsoever for any loss, whether direct or indirect, or consequential loss, that may arise from the use of information or opinions provided.

