
When Diversification Isn’t A Free Lunch
25 June 2016
By Marlena Lee, PhD (Vice President, Research), Wes Crill, PhD (Vice President, Research), Philipp Meyer-Brauns, PhD (Research)
Dimensional Fund Advisors

Diversification has been called the only free lunch in investing. This claim is rooted in Markowitz’s work on modern portfolio theory, which showed that through diversification, combinations of assets could reduce volatility without reducing expected return or increase expected return without increasing volatility, relative to individual assets.
Many investors have taken heed. Highly diversified portfolios of global stocks and bonds are readily available to investors at very low fees. A global stock portfolio can hold thousands of stocks in over 40 developed and emerging markets countries. A global bond portfolio could be diversified across bonds issued by many different governments and companies in a range of interest rate environments. Global real estate investment trusts (REITs) can provide exposure to more than 127,000 properties across 53 different countries. In short, the global market portfolio is incredibly well diversified.
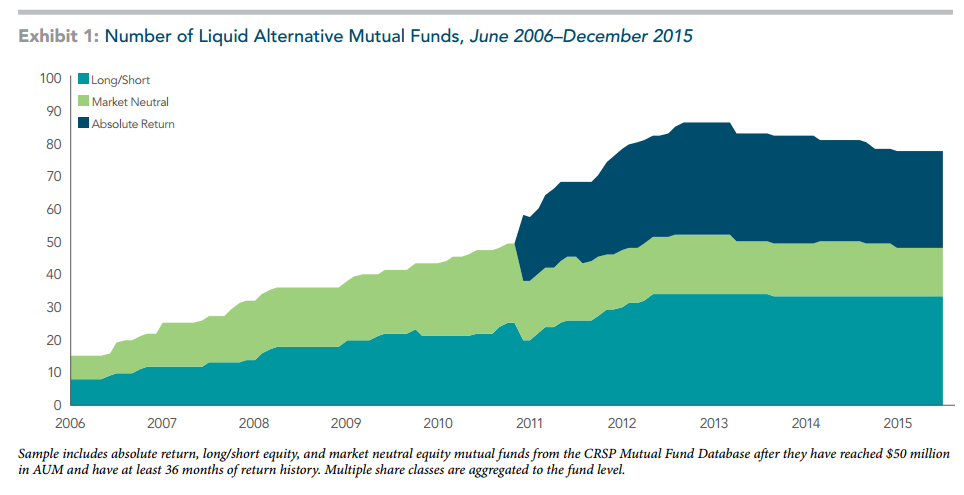
But can investors do even better? In pursuit of greater gains from diversification, some investors look to alternative assets with low correlations to traditional asset classes. Liquid alternative strategies may start from the same building blocks as the global stock and bond market, but these strategies select, weight, and even short securities in an attempt to deliver positive returns that are uncorrelated to the market. Exhibit 1 shows that the number of long/short equity, market neutral equity, and absolute return mutual funds has grown substantially from June 2006 to December 2015.1
The proliferation of these funds is quite remarkable given their poor historical performance. Exhibit 2 shows that from June 2006 to December 2015, these funds in aggregate returned 49 basis points annualized, which was half the return on one-month US Treasury bills and with far more volatility.2 These funds also fell far short of broad equity and fixed income indices. Some of this underwhelming performance is likely due to high turnover and fees. With an average expense ratio of 1.38%, the benefit to the fund managers was almost three times as large as that to the investor.
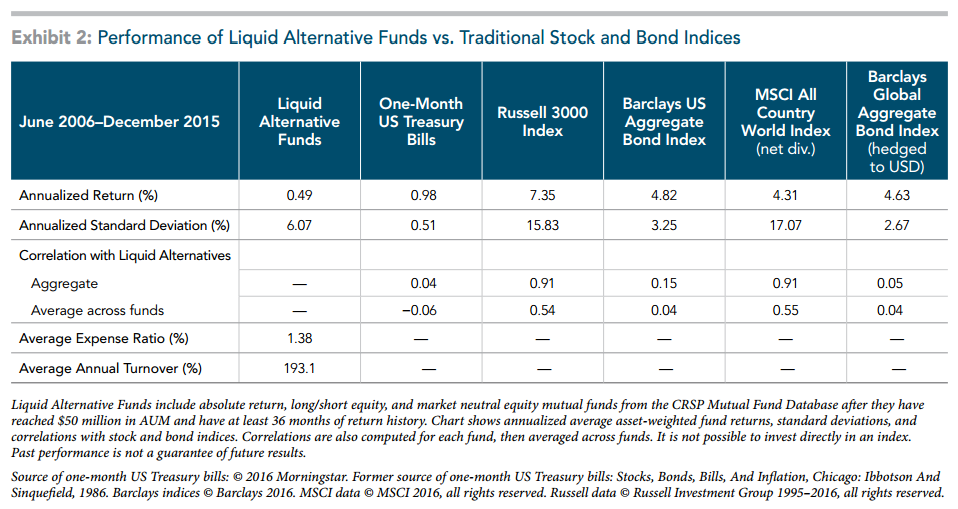
In aggregate, these funds had high correlations of 0.91 with US and global equities. The average fund was correlated about 0.55 with equities, although there was a wide range from 0.01 at the 10th percentile to 0.93 at the 90th. This wide range is likely due in part to the many different types of underlying strategies managers may employ. Some may try to pursue systematic premiums, such as size, value, and momentum, while others may attempt to harvest statistical arbitrage opportunities, such as merger or convertible arbitrage. Some may use traditional active approaches in an attempt to pick individual stocks or time markets and premiums. In aggregate, however, these approaches have not yielded attractive returns over this sample period.
These categories of mutual funds are relatively new, which limits our sample period to just shy of 10 years. However, many performance studies that focus on long-only mutual funds find little evidence that managers can time markets or pick securities well enough to add value over systematic premiums after fees.3 If it is difficult for most managers to add value in long-only strategies, why should investors expect managers to add value if they can also short, especially given the higher fees these strategies tend to charge and the potentially higher costs of shorting? Studies on hedge funds also cast doubt on the ability of managers to add value. For example, Bhardwaj, Gorton, and Rouwenhorst (2014) find that commodity trading advisors (CTAs) had average returns that were not reliably different from US Treasury bills over the period from 1994 to 2012.4
Convinced Yet? If Not…
Maybe it’s because your long/short strategy pursues systematic premiums and hedges out market exposure in order to achieve a low correlation to the market. For example, consider an investor who is thinking about adding a market neutral strategy to his current portfolio, which is invested in the Russell 1000 Index. From 1979 to 2015, this hypothetical long/short portfolio had an average annual return of 3.6% and had a negative correlation of −0.35 with the Russell 1000. If he were to allocate 10% of his portfolio away from the Russell 1000 and into the long/short strategy, this would have decreased his standard deviation from 16.8% to 14.6%. He would have also sacrificed some return (from 11.7% to 11.3% annualized), but the net effect is an increase in Sharpe ratio from 0.50 to 0.52.5 Is this Sharpe ratio enhancement due to diversification because of the negative correlation between the two strategies?
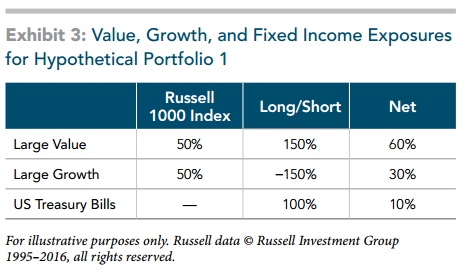
To answer this question it may be helpful to have more details about this hypothetical long/short strategy. It is invested 150% in the Russell 1000 Value Index, −150% (short) in the Russell 1000 Growth Index,6 and 100% in one month US Treasury bills to serve as collateral.7 Exhibit 3 shows the overall allocation after adding up all the positions. The first column says that a 100% investment in the Russell 1000 Index is approximately half in value and half in growth.8 The second column shows the value and growth exposures for the hypothetical long/short strategy. If the investor puts 90% in the Russell 1000 Index and 10% in the long/short strategy, he ends up with a portfolio that has 60% exposure to value (90% × 50% + 10% ×150% = 60%), 30% to growth and 10% in fixed income. Let’s call this Portfolio 1.
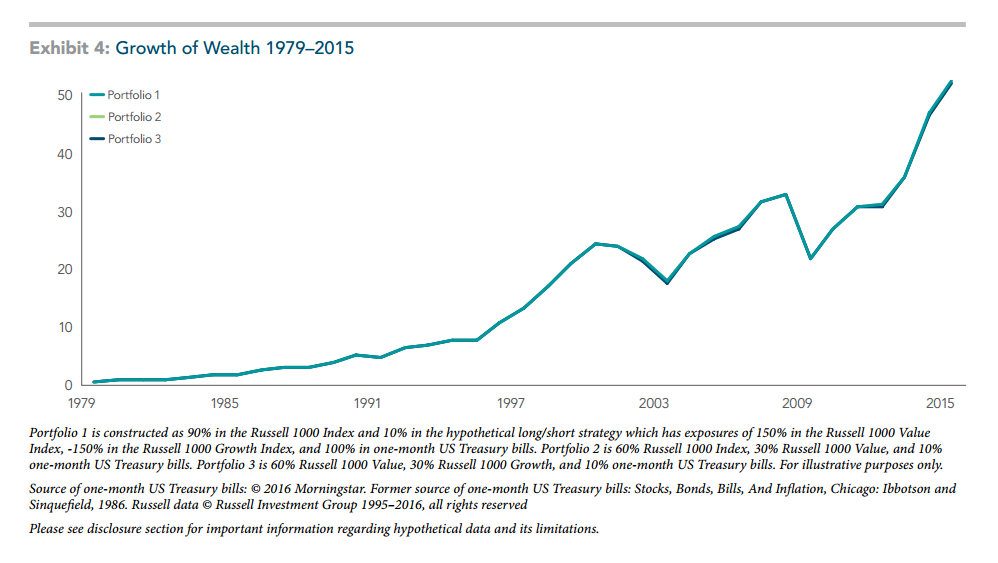
There are multiple ways the investor could achieve these net exposures. Instead of the long/short strategy, consider Portfolio 2, which has 60% in Russell 1000, 30% in Russell 1000 Value, and 10% in bills. A third option, Portfolio 3, has 60% in Russell 1000 Value, 30% in Russell 1000 Growth, and 10% in bills. Exhibit 4 shows that the growth of wealth in each of these three hypothetical portfolios is virtually identical, at least before costs. Over this sample period, a dollar investment in Portfolios 1, 2, and 3 would have grown to $52.44, $52.28, and $51.96, respectively.
Although the performance before costs is nearly identical, Portfolio 1 would incur higher costs than its long-only equivalents. It holds growth securities long in one part of the portfolio and shorts them in another. This approach would almost surely incur higher costs than just underweighting growth stocks.
Let’s return to our original questions. How did adding the long/short reduce volatility? By reducing market exposure by 10%. Did it add diversification? Only if you think holding 60% Russell 1000 Value and 30% Russell 1000 Growth is more diversified than holding 90% Russell 1000. In other words, does a value tilt increase diversification even though it is just a reweighting of the same set of 1,000 stocks?9
If a long/short strategy is working with the same building blocks as a traditional market portfolio, the net effect of the long/short added to the market portfolio is over- and underweights in particular areas of the market. There may be compelling reasons to deviate from market cap weights, but additional diversification should not be one of them; the market portfolio is already incredibly diversified.
Focusing on securities with higher expected returns is a good reason to deviate from the market portfolio. But this involves a different type of analysis. Rather than examining correlations, investors should ask whether a premium is sensible, backed by robust empirical evidence, and cost effective to capture. This last point is vitally important. If investors have confidence in a premium, they should pursue it in the most cost-efficient way possible, which will be in an integrated long-only portfolio with overand underweights, rather than in a long/short vehicle.
The Free Lunch Bait and Switch
There are numerous benefits to diversification beyond volatility reduction. Broad diversification can improve the reliability of performance outcomes and impart flexibility to a portfolio, a necessary ingredient for efficient trading. These are all reasons investors should consider building well-diversified portfolios.
The irony is that investors could end up worse off if they make poor choices in the name of diversification. For example, narrow subsets of the market portfolio may have low correlations with the market specifically because they have a lot of idiosyncratic risk. After all, a single stock will tend to have a lower correlation with the market than a diversified portfolio. Holding large positions in narrow market segments would reduce diversification relative to simply holding the broad market.
Investors should also keep an eye on their overall investment goal, which likely requires balancing expected returns against risks. Market prices reflect the aggregate expectations of investors, including information about the diversification benefits of a security. If an asset class is expected to provide great diversification benefits, investors might be willing to hold it at a lower expected return. After all, many assets that reduce risk have relatively low expected returns. A put option can offer downside protection and has a negative correlation with equities but can come at a very high price.10 Investors should be skeptical of any alternative investment that is touted as a great diversifier with high expected returns, especially if it also has a high fee. Diversification’s free lunch promise has its limits.
References
- Bhardwaj, Geetesh, Gary B. Gorton, and K. Geert Rouwenhorst. 2014. “Fooling some of the people all of the time: The inefficient performance and persistence of commodity trading advisors.” The Review of Financial Studies 27.11 (2014): 3099-3132.
- DeSantis, Massi and Marlena Lee. 2016. “How Sharp are Sharpe Ratios?” Dimensional Fund Advisors. Fama, Eugene F., and Kenneth R. French. 2010. “Luck versus Skill in the Cross‐Section of Mutual Fund Returns.” The Journal of Finance 65.5 (2010): 1915–1947.
- O’Reilly, Gerard. 2016. “The World is More than Enough.” Dimensional Fund Advisors.
- Shah, Ronnie. 2011. “Demystifying Hedge Funds: A Review.” Dimensional Fund Advisors.
Footnotes
- See appendix for descriptions of these Lipper categories.
- Performance was poor in each subcategory as well. Annualized average return for long/short and market neutral was -36 and 108 basis points, respectively. Absolute return funds returned 69 basis points annualized but over a shorter sample period: May 2011 to December 2015.
- See Fama French (2010) for a recent example. A summary of this paper can be found at https://famafrench.dimensional.com/essays/luck-versus-skill-in-mutual-fund-performance.aspx
- See Shah (2011) for a survey of studies on hedge fund performance at https://my.dimensional.com/insight/papers_library/79248/.
- For a discussion of why investors should be cautious when using Sharpe ratios to analyze performance, please see De Santis and Lee (2016) How Sharp are Sharpe Ratios? https://my.dimensional.com/insight/purely_academic/182716/.
- These exposures could be achieved using futures positions.
- Long/short strategies often apply leverage. This hypothetical example has a leverage ratio of 1.5.
- This is, by construction, due to the way Russell defines value vs. growth.
- For a more formal treatment, please see Fama and French (2016) https://famafrench.dimensional.com/essays/longshort-investment-strategies.aspx and O’Reilly (2016) The World is More than Enough. Dimensional Fund Advisors.
- For a quantification of the costs associated with buying put options for downside protection, please see Black and Wang (2015) https://my.dimensional.com/insight/purely_academic/161287/
Appendix
A1. Lipper Class Code Descriptions
Absolute-Return Funds (ABR) are funds that aim for positive returns in all market conditions. The funds are not benchmarked against a traditional long-only market index but rather have the aim of outperforming a cash or risk-free benchmark.
Equity Market Neutral Funds (EMN) are funds that employ portfolio strategies that generate consistent returns in both up and down markets by selecting positions with a total net market exposure of zero.
Long/Short Equity Funds (LSE) are funds that employ portfolio strategies that combine long holdings of equities with short sales of equity, equity options, or equity index options, the fund may be either net long or net short depending on the portfolio manager’s view of the market.
#
If you have found this article useful and would like to schedule a complimentary session with one of our advisers, you can click the button below or email us at customercare@gyc.com.sg.

Share
IMPORTANT NOTES: All rights reserved. The above article or post is strictly for information purposes and should not be construed as an offer or solicitation to deal in any product offered by GYC Financial Advisory. The above information or any portion thereof should not be reproduced, published, or used in any manner without the prior written consent of GYC. You may forward or share the link to the article or post to other persons using the share buttons above. Any projections, simulations or other forward-looking statements regarding future events or performance of the financial markets are not necessarily indicative of, and may differ from, actual events or results. Neither is past performance necessarily indicative of future performance. All forms of trading and investments carry risks, including losing your investment capital. You may wish to seek advice from a financial adviser before making a commitment to invest in any investment product. In the event you choose not to seek advice from a financial adviser, you should consider whether the investment product is suitable for you. Accordingly, neither GYC nor any of our directors, employees or Representatives can accept any liability whatsoever for any loss, whether direct or indirect, or consequential loss, that may arise from the use of information or opinions provided.

