
Market Volatility
26 February 2016
By Dimensional Fund Advisors

The market events of January 2016 provide an opportunity to examine several questions important to investors and revisit some fundamental principles of investing in capital markets.
We Should Expect Volatility
It is important to remember how well-functioning capital markets work and what prices reflect. Prices reflect the aggregate expectations of market participants. Risk aversion, investors’ tastes and preferences, and expectations about future profits are among the many inputs that affect aggregate expectations. We should expect these inputs to vary day-to-day. This implies we should expect aggregate expectations to vary from day-to-day. Markets adapt to changing expectations and new information. As a result, we expect prices, as well as the level of volatility, to fluctuate. It is interesting to think of the alternative: If prices did not adjust and remained constant, we would be concerned that markets were not functioning properly.
January 2016
Do returns during January provide information about returns during the remainder of the year? As we would expect over any period, prices in January 2016 changed from day-to-day as aggregate expectations changed and investors processed new information. During the month, the S&P 500 Index had a return of −4.96%, the ninth lowest return for the index since 1926. The first two weeks of January was the worst start to the year for the S&P 500 in history, with the index returning −7.93% from January 4–15. Based on this information, some investors may wonder whether the returns in January have some predictive power for the returns during the remainder of the year. Exhibit 1 shows the returns of the S&P 500 Index for the month of January compared with the subsequent 11-month return (i.e., February through December). We find that a negative January was followed by a subsequent 11-month return that was positive 59% of the time, with an average return of 7%, indicating a negative January does not predict poor market returns for the rest of the year.
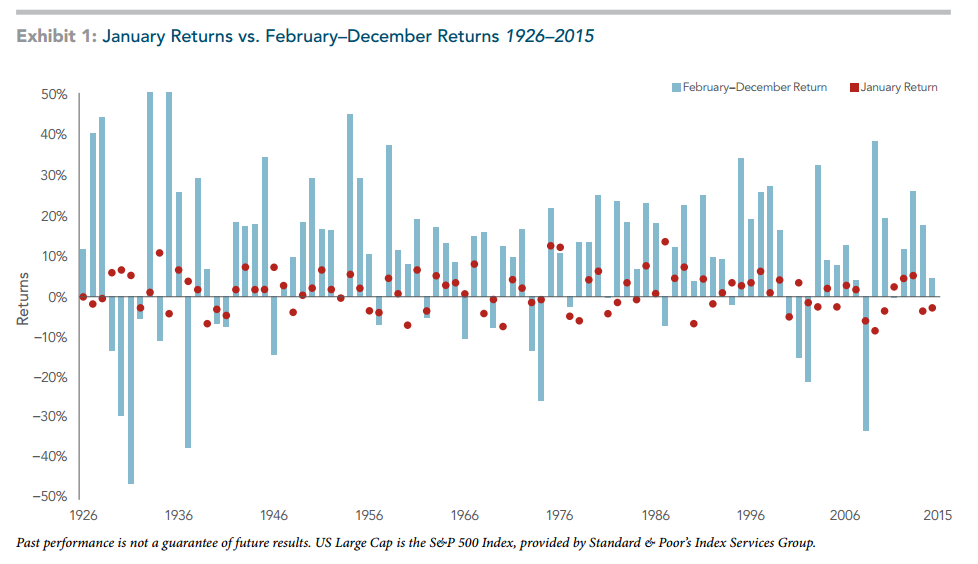
One additional note: if we look at the five lowest January returns, excluding January 2016, the average return for the remainder of the year was 13.8% and none of these years finished in the lowest 20 years of annual returns for the S&P 500 Index.
Previous Market Declines
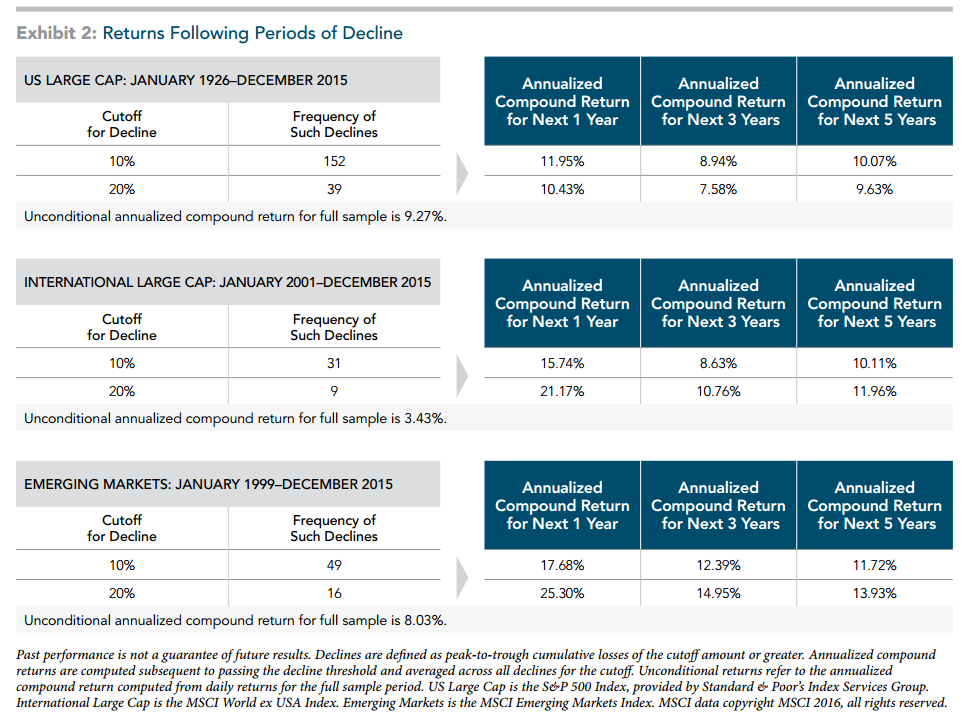
What have we seen during previous market declines? As mentioned above, the YTD return for the S&P 500 through January 2016 was −4.96%. From the previous high on November 3, 2015 through its low on January 15, 2016, the S&P was down −10.43%, its second decline of at least 10% since the beginning of August 2015. We can look at the data in Exhibit 2 to see how the US market has performed in subsequent periods following different magnitudes of decline. The exhibit looks at previous times when the S&P Index has declined by 10% and 20%, and shows the subsequent one-, three-, and five-year return. Independent of the magnitude of decline, on average, the return of the S&P 500 over the periods referenced has been positive and greater than the long-term average of 10.02% in half of the time periods observed. The chart also provides information on developed ex US and emerging markets, where we have seen similar results.
Volatility
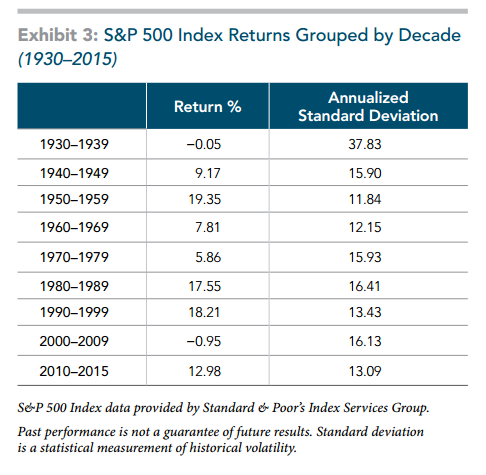
Is the recent period abnormally volatile? For the period January 1926 to December 2015, the S&P 500 had a compound return of 10.02% and a standard deviation of 18.85. Looking over a more recent period, from January 2010 through December 2015, the return for the S&P 500 has been 12.98% with a standard deviation of 13.09. Comparing these results with other historical periods, we can see the recent period has not necessarily been more volatile. During the so-called “Lost Decade” from January 2000 to December 2009, the S&P 500 Index had a compound return of −0.95% and an annualized standard deviation of 16.13. When we continue to look at the data in Exhibit 3, grouped by decade starting in January 1930, we see periods of higher and lower returns as well as periods of greater and lesser volatility.
Importance of Discipline
While in the midst of a market downturn, we may be inclined to look for some type of signal as to what the recent period means for future returns or to assume the current period is somehow different from what we have observed historically. Before jumping to conclusions or attempting to make predictions about what the future may hold, analyzing the available data can provide perspective. It is also important to remember that there is ample evidence that suggests prices adjust in such a way that every day there is a positive expected return on our invested capital. While the realized return over any period may be positive or negative, in expectation we believe markets will go up. As investors, we should remain disciplined through all periods in order to capture the expected returns the market offers.
(Link to Video)
#
If you have found this article useful and would like to schedule a complimentary session with one of our advisers, you can click the button below or email us at customercare@gyc.com.sg.

Share
IMPORTANT NOTES: All rights reserved. The above article or post is strictly for information purposes and should not be construed as an offer or solicitation to deal in any product offered by GYC Financial Advisory. The above information or any portion thereof should not be reproduced, published, or used in any manner without the prior written consent of GYC. You may forward or share the link to the article or post to other persons using the share buttons above. Any projections, simulations or other forward-looking statements regarding future events or performance of the financial markets are not necessarily indicative of, and may differ from, actual events or results. Neither is past performance necessarily indicative of future performance. All forms of trading and investments carry risks, including losing your investment capital. You may wish to seek advice from a financial adviser before making a commitment to invest in any investment product. In the event you choose not to seek advice from a financial adviser, you should consider whether the investment product is suitable for you. Accordingly, neither GYC nor any of our directors, employees or Representatives can accept any liability whatsoever for any loss, whether direct or indirect, or consequential loss, that may arise from the use of information or opinions provided.

